The All Load Samples page shows details for samples that have been taken for loads.
Viewing Actual and Computed Sample Details
- Clicking on the compass caliper icon
 opens a sub-window showing the actual (scaled) pieces for the sampled load.
 - Clicking the plus icon
 opens the Sample Details (Computed) sub-window that shows the computed (calculated) pieces for the load.
The sub-windows show a summary of the load at the top, and a grid of all pieces in the load with volumes and acceptable fibre. To show/remove columns in the grid on the sub-window, right-click a column header and select Columns to see the list of what is available and currently selected. You can also save a layout using the layout menu bar at the top of the page.
opens a sub-window showing the actual (scaled) pieces for the sampled load. opens the Sample Details (Computed) sub-window that shows the computed (calculated) pieces for the load. Filtering Tickets by Date
You can filter the tickets that are displayed in the grid by date. For details, see Date Filters.
The date filters on this page include the option of including tickets that have been modified within the selected date range. By default the date range is used to filter tickets using the original scale date. If you select the Modified checkbox (Off by default), any ticket that was modified within the selected date range and re-synced to the app will be included in the grid.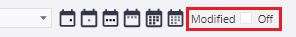
Filtering Tickets by Columns
You can filter the tickets that are displayed in the grid using any of the columns in the grid (for example, you can limit the tickets that are displayed to a particular Hauler). For details, see Filtering.
Choosing Columns to Display in the Grid
You can change the columns that are displayed in the grid. For details, see Visible Columns.
Ordering and Resizing Columns
The order of columns in the grid can be changed, as can the width of each column. For details, see Reordering and Resizing Columns.
Exporting Tickets
Records in the grid can be exported to various formats. To export, filter the grid to show the records that you want to export, click the Export button  at the top-right corner of the page, and select the appropriate format from the dropdown list. For more information on exporting data, see Exporting Data.
Printing Tickets
There are two different ways you can print ticket details:
- Click the Preview Report icon
 for an entry in the grid. This prints the details only for the ticket that you click, using the report that has been defined as the default report for load samples.
 - Select the tickets that you want to print in the grid and click the Run Report button
 above the grid. This prints the details for all of the tickets that are selected in the grid, using the report that is currently set on the Run Report button. If you want to use a different report, click the arrow button next to the Run Report button
  above the grid and select the report (which places a checkmark next to it) before clicking the Run Report button.